How to Analyze Sales Performance Using the Sales Dashboard in Invent ERP
Learn how to monitor revenue, track sales trends, review team performance, and make data-driven decisions using the Sales Dashboard.
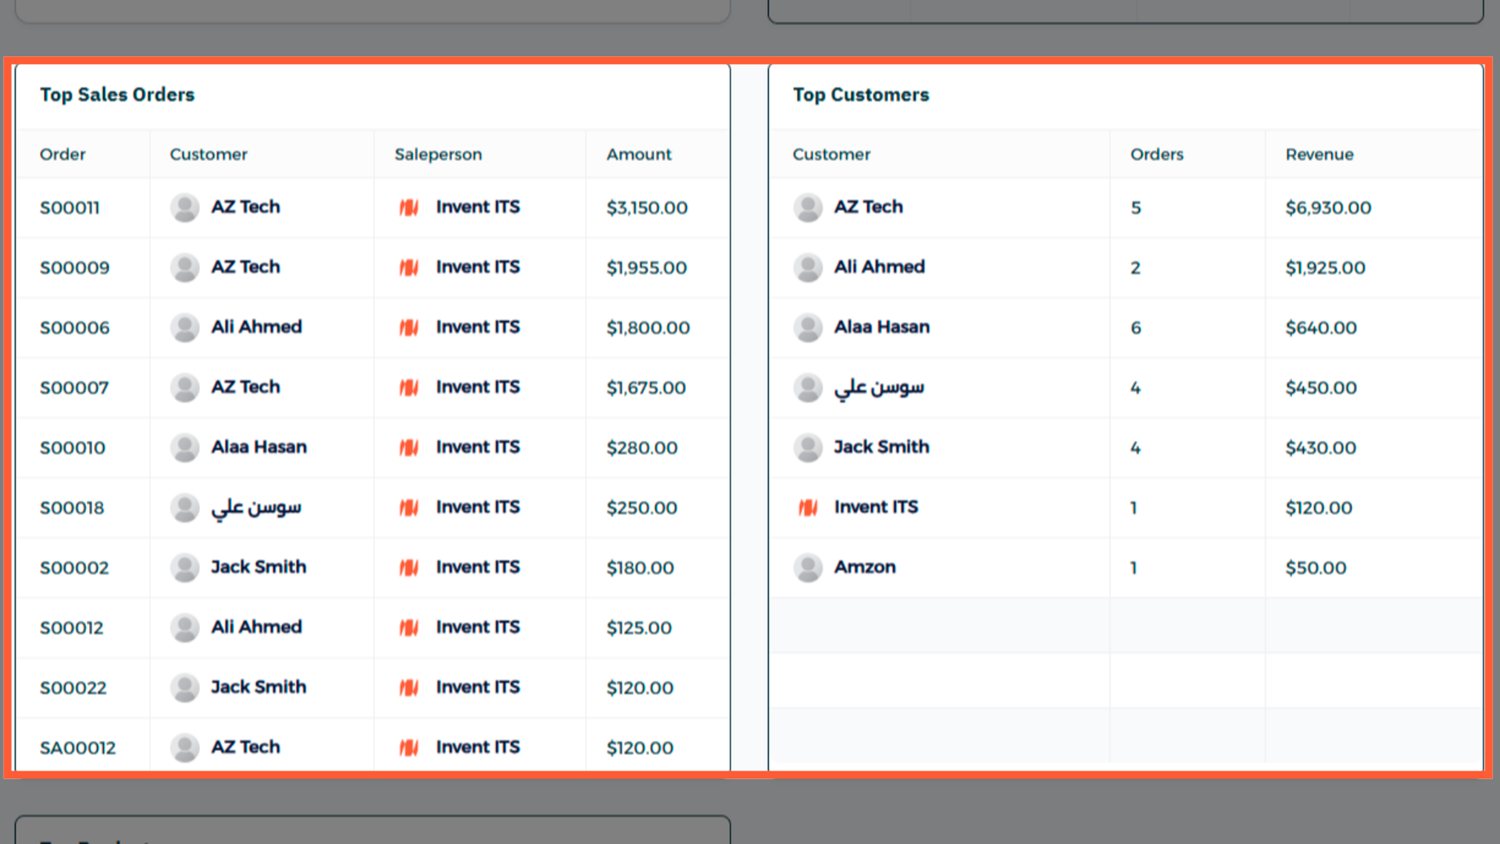
Dashboard Overview & Layout
The Sales Dashboard provides a clear, real-time overview of your sales performance — all within Invent ERP. Whether tracking leads, quotations, orders, or revenue, this dashboard helps you spot trends, monitor KPIs, and make data-driven decisions.
When you open the Sales Dashboard, you'll typically see:
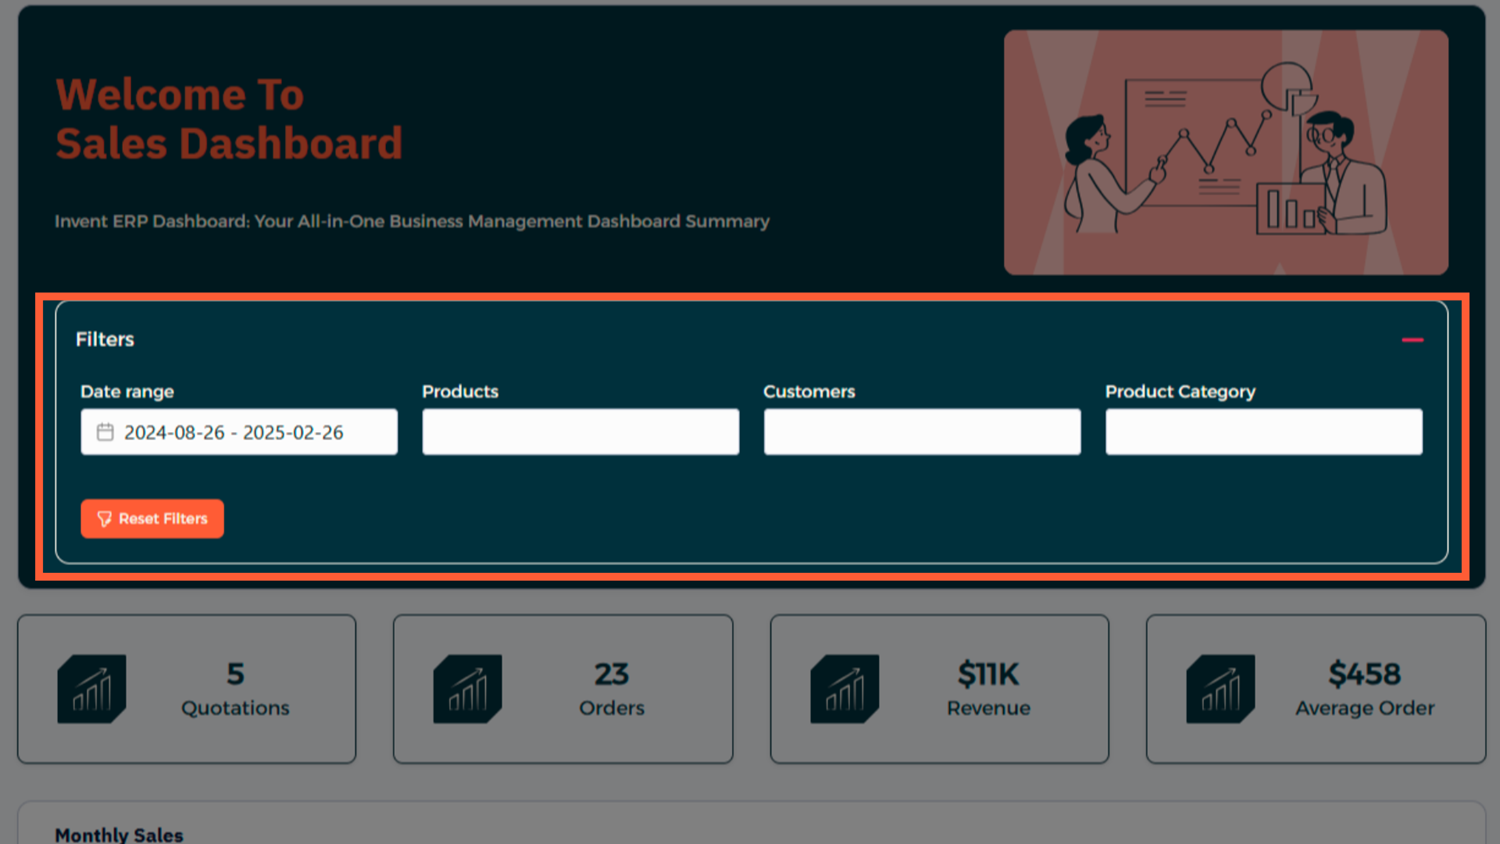
- Sales Overview / Filters — time frame, users, product categories
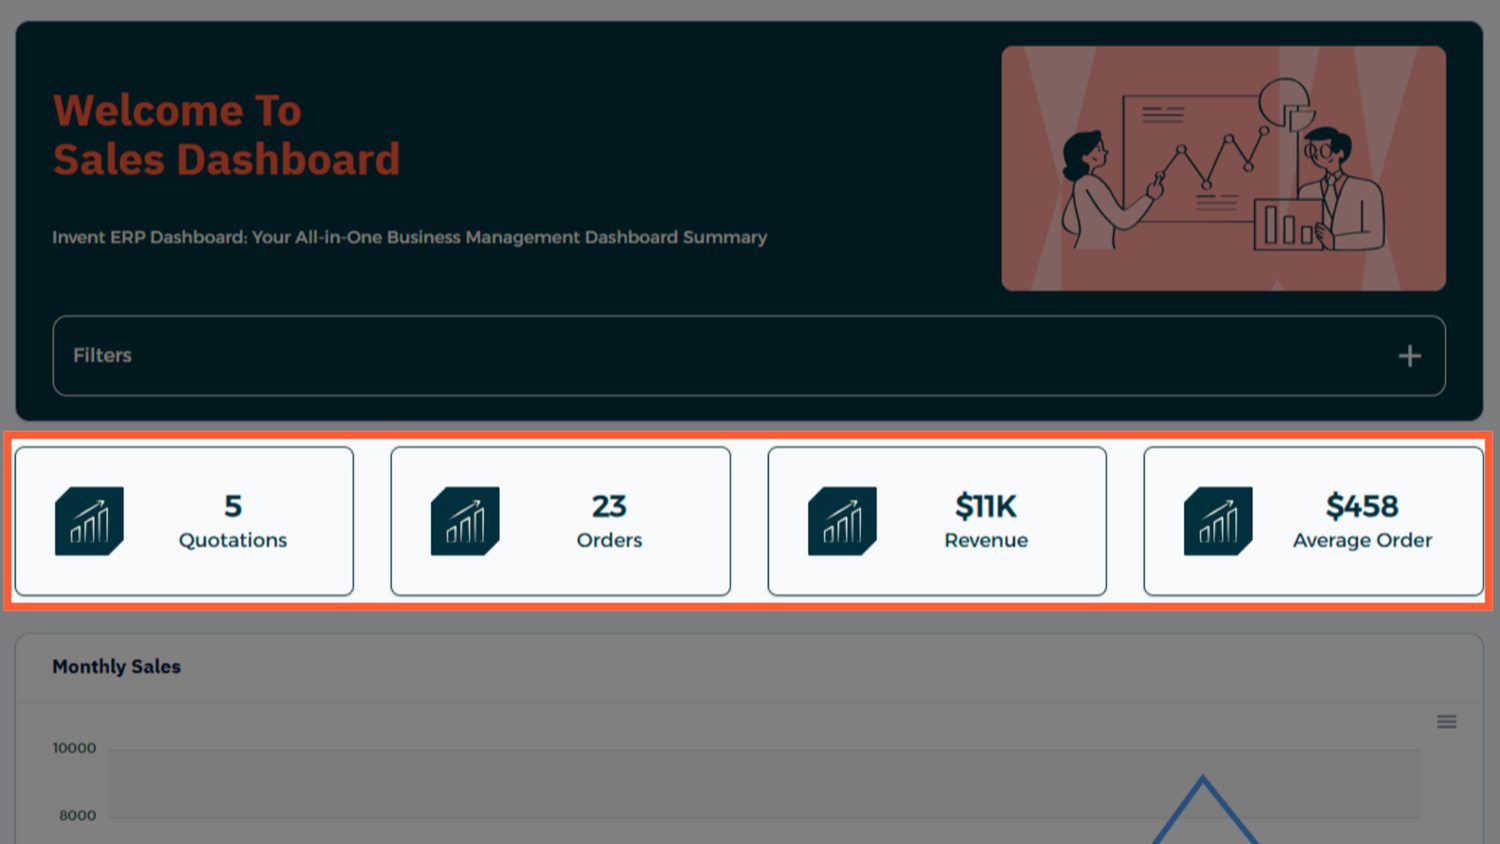
- KPIs — total revenue, number of orders, average order value
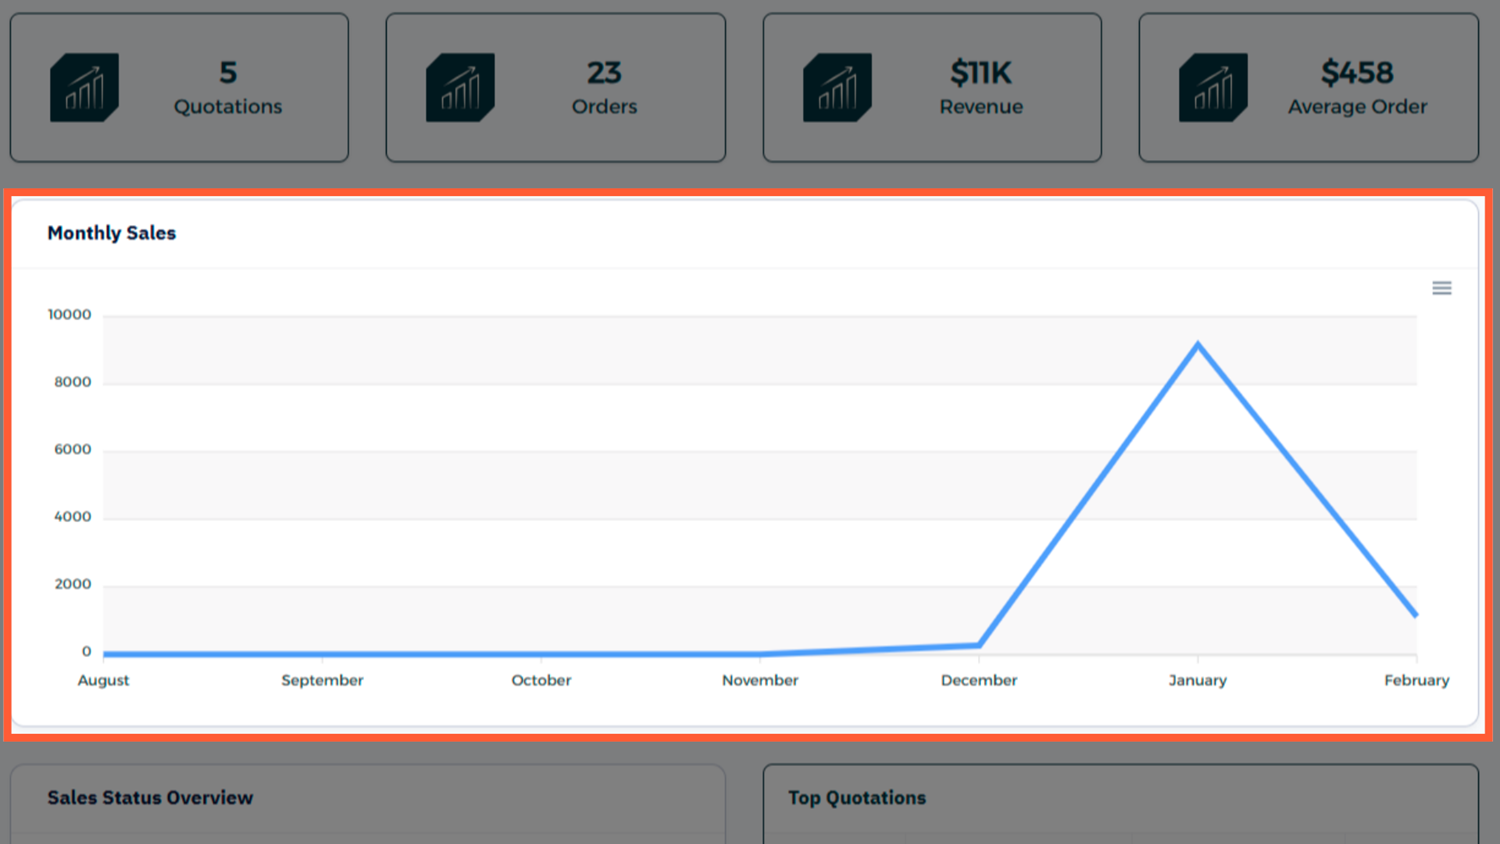
- Chart Visualizations — bar or line charts showing sales over time
- Top Categories — best-selling products or services
Each panel is interactive — click any part of a chart or table to access the underlying data.
Step-by-Step Process
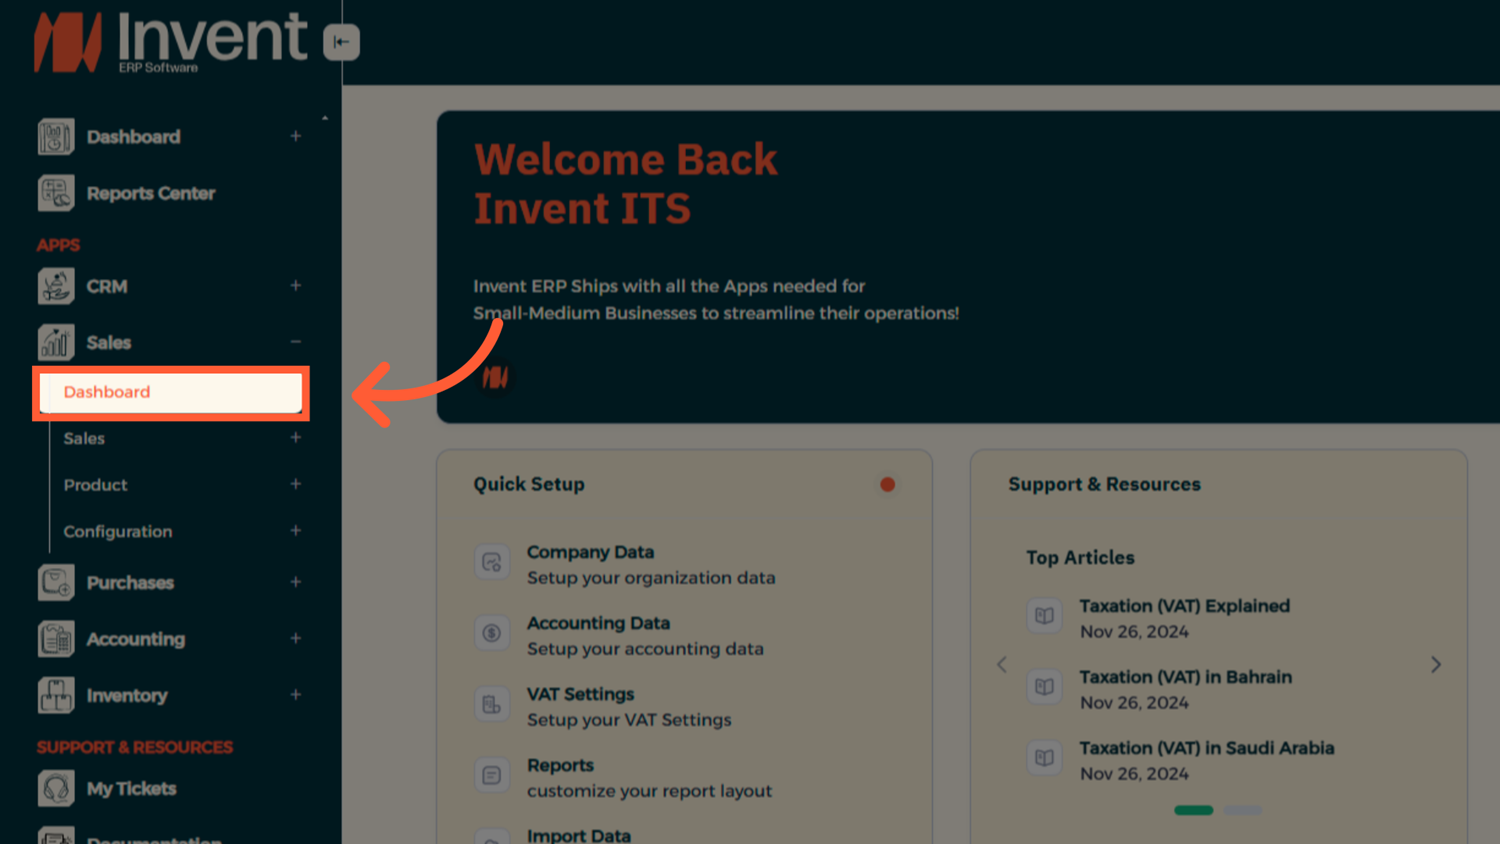
Step 1: Navigate to the Sales Dashboard
Step 2: Adjust Filters
Use filters at the top to adjust date ranges, sales reps, or product categories.
Step 3: Read the KPIs
The dashboard highlights metrics like total sales revenue, number of quotations sent, number of sales orders confirmed, and average transaction value.
Step 4: Explore Sales Over Time
View trends month-by-month and compare performance across previous periods.
Step 5: Spot Top Products and Customers
Check which products or clients contributed most to revenue to guide future sales strategy.
End-to-End Workflow
From the Sales Dashboard, users can seamlessly transition into the full sales cycle:
- Start by creating a Quotation
- Once confirmed, convert it into a Sales Order
- Generate an Invoice directly from the order
- Register the Payment once it's received
Best Practices
- Regular Review — Check daily or weekly to stay informed.
- Set Goals — Use filters to track progress toward monthly targets.
- Share Insights — Export charts or data for team meetings.
- Watch Trends — Identify slow-moving products or underperforming reps quickly.
FAQ
Q: Can I customize the dashboard layout? Yes with admin permissions, you can rearrange columns, add filters, and adjust date ranges.
Q: Does it update in real time? The dashboard typically refreshes every few minutes, but you can manually refresh for the latest data.
Q: Can I export data from the dashboard? Yes you can export chart data or KPI tables to CSV or PDF.